


Enterprise retailers improve decision accuracy with AI in concrete, repeatable ways. They replace manual, history-only methods with models that read many demand signals. This guide breaks down five documented wins across four retail verticals. Each case names the data sources, the modeling approach, and the validation. Every number below is real and measured against each retailer's own baseline. The methodology section then distills what made these forecasts work.
What Counts as a Decision Accuracy Improvement
A decision accuracy improvement is a measured rise in how well forecasts match sales. Teams track accuracy in percentage points, not percentages. A move from 50 to 65 percent is a 15-point gain, not a 30 percent one. Baselines differ by vertical. Grocery often starts higher than fashion because demand is steadier. A double-digit gain, held across two or more seasons, is the enterprise bar.
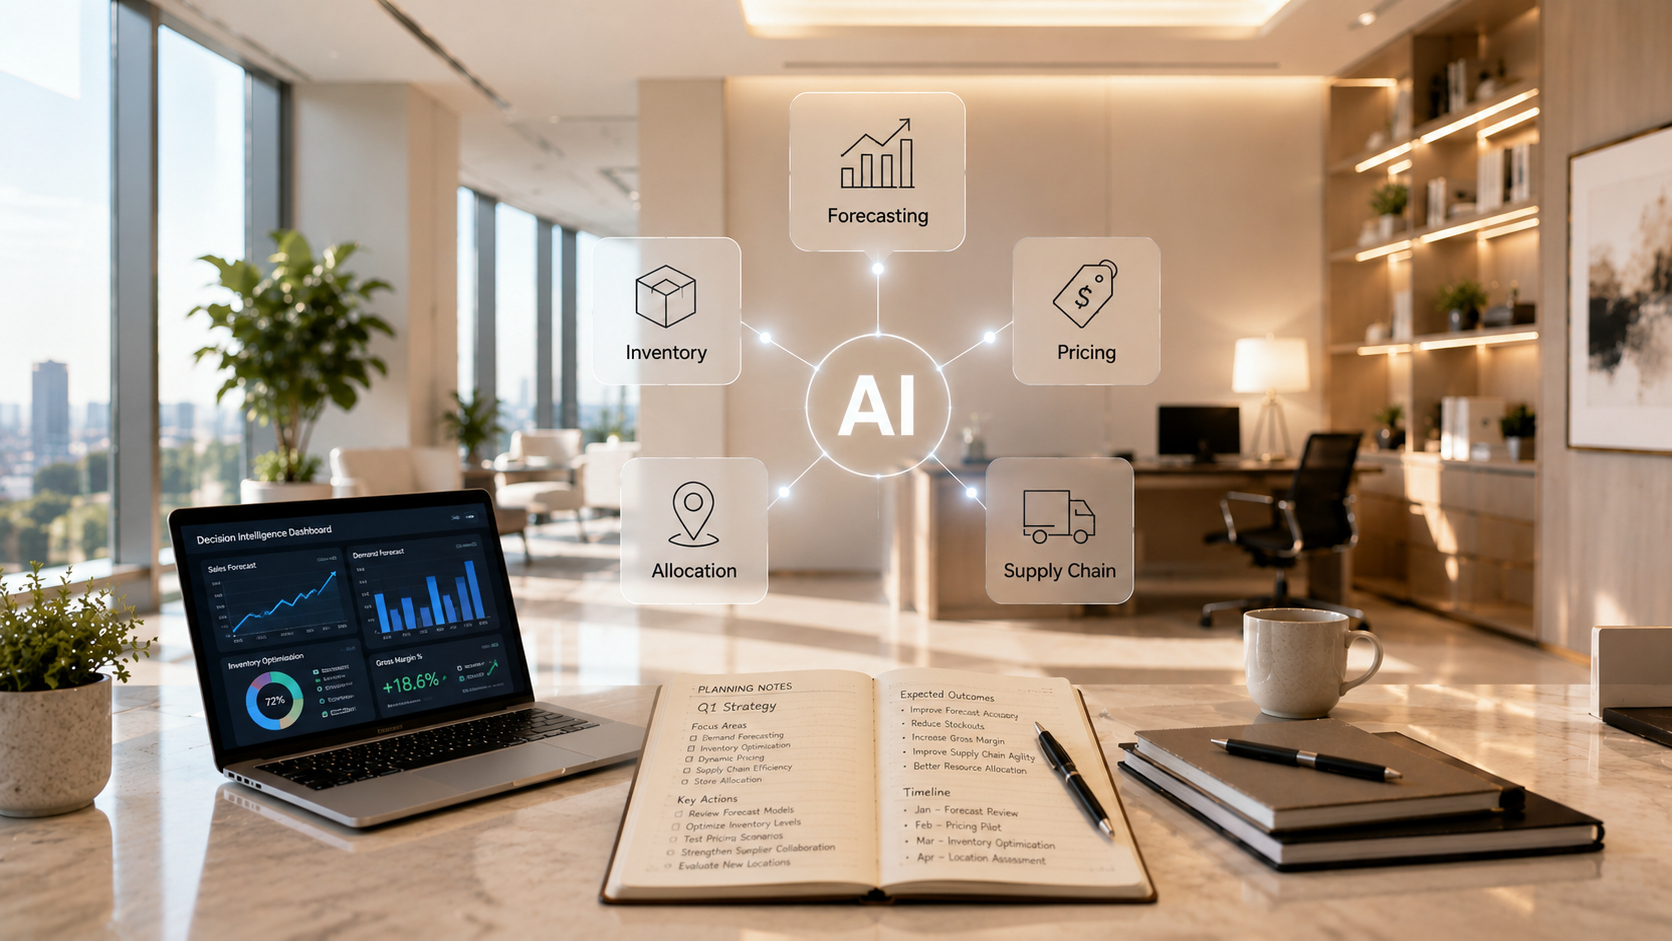
Here is how AI lifts accuracy in practice. AI & ML ingest historical sales data and live demand data. They learn the patterns that predict future demand at the SKU level. The models simulate how price, weather, and events shift demand. Trend analysis flags changes in demand before they reach the shelf.
AI models analyze vast amounts of data to surface patterns and trends humans miss. They turn historical data and real-time signals into predictive insights. The payoff is greater accuracy and the ability to prevent stockouts.
Accurate forecasts then feed supply chain optimization downstream. They set inventory levels that match real demand, not last year's guess. Right-sized inventory levels lower carrying costs and help reduce waste. Cleaner inputs and supplier performance data sharpen every forecast. This also tightens supply chain management from buying to replenishment. Together, they improve supply chain performance end to end. Better forecasts make the whole supply chain more resilient.
For a fuller benchmark set, see our demand planning KPIs guide.
Five Documented Accuracy Wins, Case by Case
Enterprise chains improve accuracy with AI in measurable, proven ways. The five wins below span grocery, footwear, luxury, and specialty retail. Each pair a result with the method and validation behind it.
Grocery Chain, Asia and the Middle East
A large grocery chain across Asia and the Middle East forecasts demand by hand. Its planners triangulated many data sources, which bred anomalies and guesswork. Demand spanned ambient, frozen, chill, and cafe lines, each with its own pattern. The chain adopted an AI system for native demand forecasting. It weighed seasonality, weather trends, and SKU recency. It also adds lost sales in the historical data used for training the models. A freshness index sharpened forecasts for perishable goods. The team proved it first through a test and control rollout in one country. The client validated the gain, then scaled across four markets. Accuracy reached 85 percent or higher at the subcategory and week level. Lost sales fell about 30 percent, and gross margin rose 2 to 3 percent. Buyers won back more than 15 percent of their time for planning.
Luxury Footwear Retailer
A luxury footwear retailer fought size complexity and volatile demand. Trends, endorsements, and economic shifts moved sales fast. Planners ran manual allocations in Excel across outlet, retail, and e-commerce. Shortages hit some stores while others sat on excess inventory. The brand adopted AI-native forecasting and automated allocation. Models predicted demand across every channel in real-time. Size curve forecasts sent the right sizes to the right stores. The AI system handled the SKU-store combinations. Lost sales units in retail dropped 25 percent year over year. Lost sales revenue in the outlet channel fell 40 percent year over year. In-stock rates held above 90 percent. Validation came from adoption itself. 93 percent of allocations needed no manual edits.
Global Luxury Lifestyle House
A global luxury lifestyle house sells over 100,000 products. It spans full-price stores, outlets, and e-commerce. Its legacy allocation system could not keep pace. Leadership moved to AI and machine learning planning tools. The models forecast at the SKU, store, and week level. Style chaining and similarity algorithms forecast new launches. These items launched with no sales history. Automated alerts flagged exceptions for planners to review. Lost sales from stockouts fell 50 percent. In-stock levels reached 95 percent with no excess inventory.
Global Luxury Fashion Brand, Multi-Region
A global luxury fashion brand ran a complex, multi-region store network. Allocation leaned on intuition, not real data. Store-level demand and size performance were hard to see. The brand deployed an AI-native allocation and replenishment platform. Machine learning models forecast demand at the SKU and store level. Those demand signals guided every allocation decision. Optimization models enforced each store's capacity and regional constraints. Standardized reports tracked lost sales, excess, and in-stock for the first time. North America projected an 11-million-dollar reduction in lost sales. That figure rested on six months of real-time operational data. EMEA projected a 21-million-dollar reduction over eleven months. Sustained data across both regions, not a single pilot, proved the result.
Multi-Brand Jewelry Retailer
A multi-brand jewelry retailer faced a hard, low-volume forecasting problem. Idle stock piled up while planners worked in spreadsheets. Few sales per item made classic models unreliable. The business moved to AI-native forecasting with clustering and best-fit modeling. Clustering grouped similar items to predict demand where the history was thin. About 90 percent of SKU-store forecasts then matched real demand closely. Lost sales fell 50 percent, and excess inventory dropped 60 percent. The gain was held as the models learned from fresh sales data each cycle. This shows AI can lift accuracy where traditional forecasting methods fail.
Methodologies That Drive Accuracy Gains
Five methods drove the accuracy gains in the cases above. Each fits a specific demand pattern. Most enterprise wins combine several at once.
- Ensemble machine learning models blend several methods into one forecast. No single algorithm wins on every product, so the mix raises accuracy. Machine learning algorithms span gradient boosting, neural nets, and time series. Best-fit modeling scores each forecasting model and picks the strongest. This forecasting model approach drove the grocery, footwear, and specialty wins.
- Attribute-based forecasting predicts demand for items with no sales history. It reads product attributes like size, color, and material instead of past sales. Style chaining and similarity algorithms powered the cold-start gains.
- Demand sensing refreshes forecasts on daily or weekly signals. It reads real-time data from point of sale, sensor feeds, and IoT devices. This agility helped the grocery chain react to the weather quickly.
- Hierarchical forecasting aligns predictions across every level. It reconciles SKU-store-week with category and region plans. It honors each capacity constraint while keeping numbers consistent. Each prediction then agrees from store to region. That gave the fashion brand real-time visibility it never had.
- Exogenous signals add context about changing market conditions, and internal data misses. Weather, promotions, events, and competitor pricing all move demand. Feeding them into the forecasting process lifts accuracy further.
Together, these AI technologies turn raw data into actionable insight. A strong AI solution uses AI for demand to optimize the forecasting process. It can streamline demand planning, optimize stock, and tailor forecasts per store. Predictive analytics and clean predictions help planners make informed decisions. AI models score every option and surface the best one seamlessly. Better forecasts mean better decisions, fewer empty shelves, and stronger ROI. In short, the platform leverages AI to keep every forecast honest. They help minimize the risk of stockouts across the network.
For the fundamentals, read our AI demand forecasting overview.